 If you have been trying to get pregnant for a while, then you are likely to have come across the topics of fertility charting and the fertile window calculator. These are a commonly used method for women to find out when they are most fertile, helping you to time sex around ovulation and ensuring the best possible opportunity for sperm to meet the egg.
As menstrual cycles vary so much from woman to woman, it is unfortunately not as simple as just calculating your mid-point of the cycle and using this time to predict when ovulation occurs. However, your body will exhibit certain signs at the time when ovulation is about to occur, and by knowing your body and recognising these signs, you can increase your chances of pregnancy greatly.
It can be a little confusing when you first start learning how to chart and work out your fertility window, so I shall try to show you the process in simple steps to make it as clear and easy as possible for you.
What is Fertility Charting?
Fertility charting is a method of documenting the important fertility signs in a clear layout, so that you can see when ovulation is going to occur, and indeed if it has occurred during a particular cycle. Once you know when you are likely to ovulate, you can then calculate your fertile window.
There are various different signs which can be documented, and you don’t need to use every single one in order to get an accurate readout of your cycle. However, particularly when you start, it may be useful to look at all of the different signs to get an idea of which may be most useful for you, and what fits most comfortably with your lifestyle.
The most important signs which are documented include:
- Menstrual Bleeding
- Basal Body Temperature
- Cervical Mucus
- Cervical Positioning and Texture
However, there are other signs which you may choose to include depending upon your cycle. These may include breast tenderness, urinary frequency, bloating etc.
Why is Charting Useful?
As mentioned above, all women have slightly different menstrual cycles. While it is said that a woman who has a 28 day cycle will ovulate on day 14, this is not actually true for everyone. The actual day of ovulation can vary greatly between women and even more so if they do not have the common 28 day cycle.
Once you ovulate, the egg only lasts for 24 hours within the reproductive tract, and this short window means that if you know the day of ovulation, then you can prepare for this and ensure that there are sperm ready to meet the egg at the correct time.
As sperm can last up to 5 days in the woman and still fertilise the egg, you ideally want to have sex within that timeframe. This is why the fertility window is the 5 days leading up to ovulation.
Therefore, knowing your cycle and using a fertile window calculator can be extremely useful when you are trying to get pregnant, and could help you get pregnant faster. This is especially true if your cycles are not regular, when working out the timing of ovulation and your fertile window can sometimes seem like guess work.
The Fertile Window Calculator
In every menstrual cycle, there are only a few days when it is possible to get pregnant. This period of time is known as the fertile window. The longest possible fertile window within a cycle is 6 days. This spans the 5 days before ovulation and 1 day afterwards. The reasoning behind this time period is that sperm can survive a maximum of 5 days in the reproductive tract, whereas the egg can only survive for 1 day if fertilization does not occur.
As if this wasn’t a short enough time frame, most pregnancies actually result from sex on the 2 days before ovulation and the day of ovulation itself, reducing the peak times of the fertile window to 3 days only.
This short time frame means that couples who focus sex during their fertile window have significantly higher pregnancy success rates. They are also more likely to get pregnant quicker than couples who do not time sex in this way. This therefore leads to the question; how do I know when my fertile window is and when does ovulation happen? The answer to that question is a fertile window calculator, which we can work out once we have charted when ovulation occurs.
Do I Need Any Equipment in Order to do Fertility Charting?
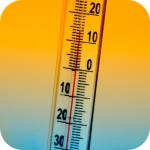
The only bit of kit that you will need is a basal body thermometer. These are accurate thermometers which can measure your temperature to the nearest 0.1 degree Centigrade. They are readily available in pharmacies and online.
Once you have this, then you are ready to go!
Where Can I Get a Fertility Chart?
Fertility charts are very easy to produce. You can create your own, depending upon the signs that you are looking at, or download our blank versions for free:
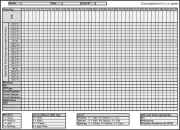
I would recommend that you have a look at our version to get an idea of the layout, but you can alter this according to what is easiest for you.
Each chart is used to document one full cycle, which is from the first day of your period until the day before your next period starts. If your cycle is irregular, it is best to leave space to allow for longer cycle lengths.
How to Produce a Fertility Chart?
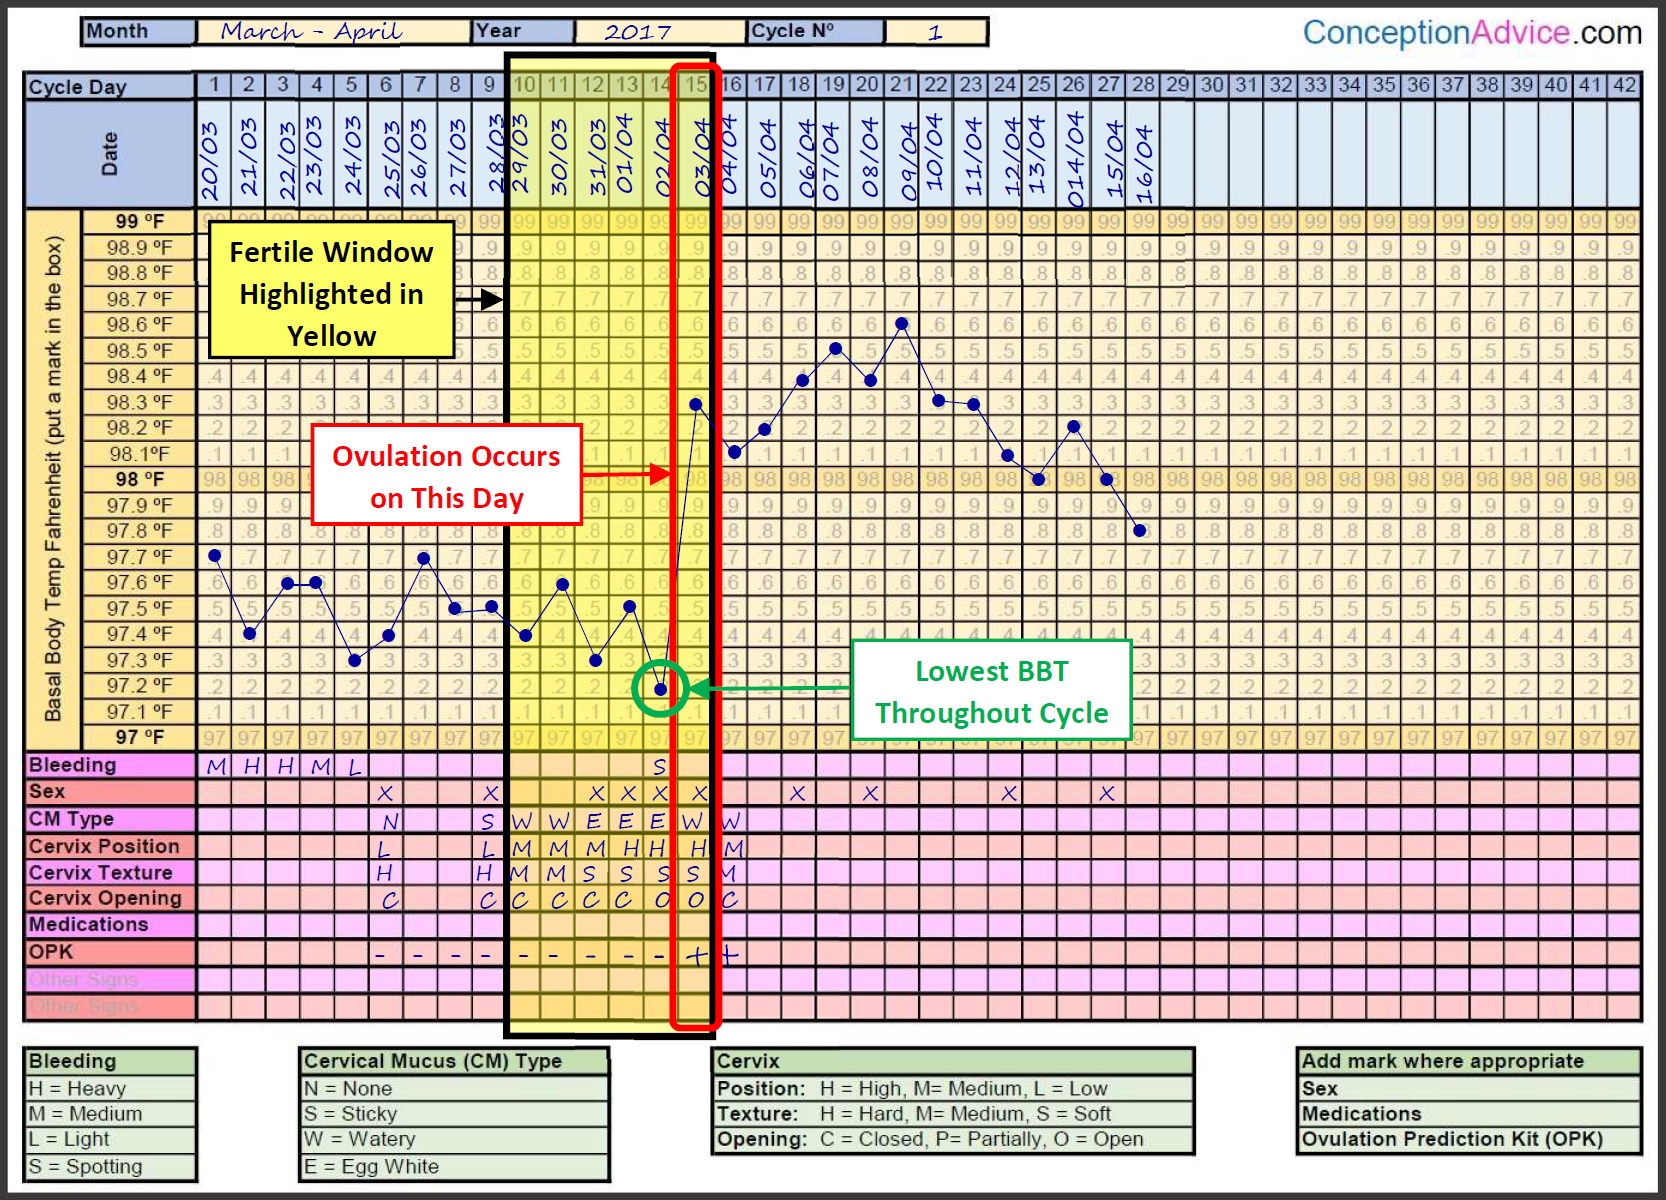
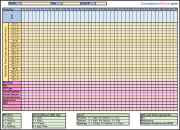
Now that you have your chart, you are ready to document those all-important signs, and calculate your fertile window. Click here to see an example of a completed fertility chart
There are different sections to document each of the signs, and it is useful to have these in alignment for each day of your cycle to make analysis easier.
Menstrual Bleeding
On this section, you document when you have your period. Your fertility chart should start on the first day of your period – this is known as Day 1 of your cycle. You can either just chart that you are bleeding, or you can document the volume of your bleeding – Heavy (H), Medium (M) or Light (L).
This section is also used to document any spotting or very light bleeding that you may experience during your cycle. This can sometimes happen at the time of ovulation, or if you become pregnant at the time of implantation (around 6 – 10 days following ovulation). It is important not to confuse this spotting with the start of a new period, and thus the end of your cycle, so remember that the first day of your period is defined as the first day of full bleeding.
Cervical Mucus
The row underneath where you document menstrual bleeding is for charting your cervical mucus. Your cervical mucus can range from None (N) at the start of your cycle, through to Sticky (S), then Watery (W), then clear and stretchy like Egg White (EW). This latter type of mucus is the one which is present leading up to the time of your fertile window.
Cervical Position and Texture
The row below is for documenting your cervical position and texture. This moves from being Hard and Low (H/L) at the beginning of your cycle to Soft and High (S/H) as you reach your fertile window.
Basal Body Temperature
The large section of the chart is for documenting your basal body temperature. This is the largest part of the chart as you need to be able to see the subtle temperature rise that occurs after ovulation has occurred. It doesn’t matter whether you use Centigrade or Fahrenheit readings, but be sure to remain consistent with these readings throughout your cycles.
You need to plot with a single point your temperature for each morning of your cycle. You may choose to draw a line between the individual points, to highlight them better and to see if you can see the expected temperature rise. Don’t expect these readings to be the same, a slight fluctuation is perfectly normal, but it is the overall trend that you are looking out for.
Sex
It is useful to note down on your chart when you have had sex. This is helpful when looking back at your completed chart as it allows you to check whether you are having sex regularly enough. Also, if you have been trying to focus sex around the time of your fertile window, you can see whether this timing has been accurate, or if you need to make any changes for the next cycle.
Other Things to Include on a Chart
Other things that you may wish to include upon your fertility chart include any other signs or symptoms that you experience on a regular basis throughout your cycle. These may include PMS type symptoms such as bloating or headaches.
If you are taking any fertility medications, it is also useful to include these as they may affect your normal cycle. These additional features can either be written in free text on your chart, or you can use one of the extra rows at the bottom to include them.
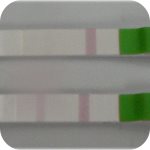
You may also wish to use ovulation kits as part of your charting. This is very useful to add to your charts as it can help you to identify the changes that are occurring in your body at the time of ovulation. Also, be aware that ovulation kits are not always 100% accurate, and so using these in conjunction with identifying your own signs can be invaluable.
It is also worth adding anything to your chart which may make the readings for that day or cycle inaccurate. This would include if you were feeling unwell with a feverish illness, as this may alter your basal body temperature. Also, if you were to develop vaginal thrush, this can alter your cervical mucus readings. Instead of discarding the readings altogether it is worth including them, but with a star, or free written text to indicate that these readings may not be accurate and shouldn’t be relied upon too heavily.
Interpreting a Fertility Chart
Interpreting fertility charts can take a little practice. The most useful thing is to compare your charts over several months, so don’t worry if you can’t work out your exact ovulation date from your first chart. It is also not a good idea to use your first few charts to identify your fertile window as you are going along through the cycle. During these months, it doesn’t mean that you have to give up trying – as long as you are having regular sex about 2 – 3 times per week then you are ensuring that there is a regular supply of sperm waiting for your egg to be released.
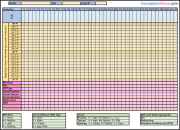
In order to identify the date in which you ovulated, you are looking for a slight increase in your basal body temperature, at the same time as your cervical mucus being clear, stretchy and like raw egg white. Your cervical position at this stage will also be soft and high. Remember that the basal body temperature rises AFTER ovulation has occurred, so the day of ovulation is deemed to be the last day of readings before the temperature has risen. Some women even notice that on this day there is a slight dip in their temperature readings.
Click here to see an example of a fertility chart showing ovulation
If these signs are not all occurring at the same time, don’t panic. Remember it is the trend that happens for you that you are wanting to identify. This is why charting over several months is really important and comparing those charts to each other to see if any trend is becoming apparent. If this isn’t happening, or you are unsure exactly how to interpret your individual charts, then take them along to your doctor who ought to be able to discuss your individual circumstances with you.
When Might Fertility Charting Not Work?
There are certain instances where fertility charting is unlikely to be of any benefit to you. If you have really long cycles where you are only getting periods every few months or longer, then I would avoid charting. This is because if you have really long cycles like this it is unlikely that you are ovulating, and I would recommend that you go and see your doctor. This may be the case in PCOS. However, a lot of women with PCOS do ovulate despite irregular cycles and charting is actually very useful for them. So, it is just in cases where your periods are really spread apart that it is unlikely to be of much benefit.
Also, if you are unlikely to be able to accurately record readings on a daily basis then fertility charting may not be for you. This might be if you have a particularly hectic and busy lifestyle, or if you are doing a lot of travelling across time zones, which can alter your sleep patterns, and thus make it difficult to identify the small changes in basal body temperature.
Some medications as well may alter your cervical mucus and your basal body temperature, so if you are taking any medications regularly check with your doctor whether or not fertility charting would be affected by these medications.
Finally, if you don’t want to do fertility charting that is also perfectly ok! If you are having sex 3 – 4 times per week then you are maximising your chances of sperm being ready to meet the egg whenever ovulation may occur during your cycle.
Can Fertility Charts Predict Pregnancy?
Yes, they can! If you have been doing fertility charting for a while and are aware of your typical chart, then it is possible to recognise some of the early signs of pregnancy before you are able to confirm this with a pregnancy test. However, a lot of women do not experience any changes in their charts, so while it is perfectly normal to scrutinise every measurement during the long 2 week wait before your period is due, don’t worry if there are none of these signs. To make matters even more confusing, you may experience some of these changes and not be pregnant. Therefore, I wouldn’t rely unduly on these, after all the best way of detecting pregnancy is with a pregnancy test!
Changes Around the Time of Implantation
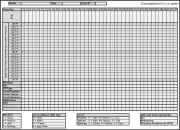
When the early embryo is beginning to implant in the lining of the womb (approximately 6-10 days post ovulation), you can experience a small amount of spotting. This can sometimes be confused for the start of your period, but is very light and lasts usually only one day.
Around the same time, you may also notice a dip in your basal body temperature – commonly referred to as the implantation dip. This dip in temperature also happens prior to your period starting, but where the temperature drop will be sustained with the onset of menstruation, at the time of implantation the dip only lasts for one day or so. This drop-in temperature may only be slightly lower than pre-ovulation levels and can easily be missed.
After Implantation
What may be slightly more reliable as a sign of early pregnancy is if your basal body temperature then increases again following this implantation dip. These changes in temperature are referred to as the triphasic temperature pattern. This higher temperature will remain raised throughout the remainder of your luteal phase and is a sign that the progesterone levels are higher than normal, as is seen in the early stages of pregnancy.
Click here to see an example of a fertility chart showing pregnancy
I Don’t Want to do a Fertility Chart, is this a Problem?
No, definitely not. Charting is not for everyone, and in fact can add to the stress of trying to get pregnant. Some women find that recording their body’s signs and symptoms can help them to identify their most fertile times and allows them some control over the process of getting pregnant. Others however find the whole process unpleasant, confusing and stressful.
Because of this, doctors tend not to recommend fertility charting for women trying to conceive. We know that if you are having sex 3 – 4 times per week on a regular basis, then when ovulation does occur, there will be a plentiful supply of sperm to fertilise that egg. It’s as simple as that (at least in theory)!
Fertility Charting Apps
There are also a lot of phone apps out there which aim to produce the fertility charts for you and use them to predict your fertile window for you.
These can be helpful, but please be aware that they are not always that accurate, and so should not be solely relied upon to predict ovulation.
Links to Popular Related Pages